The hours trend report illustrates the change in activity levels (hours, number of volunteers) over the course of a 12 month period. This report will display a snapshot by month of the number of volunteers that were engaged, the total number of hours they contributed and the average number of hours per volunteer. The report produces this information in both chart and graph format.
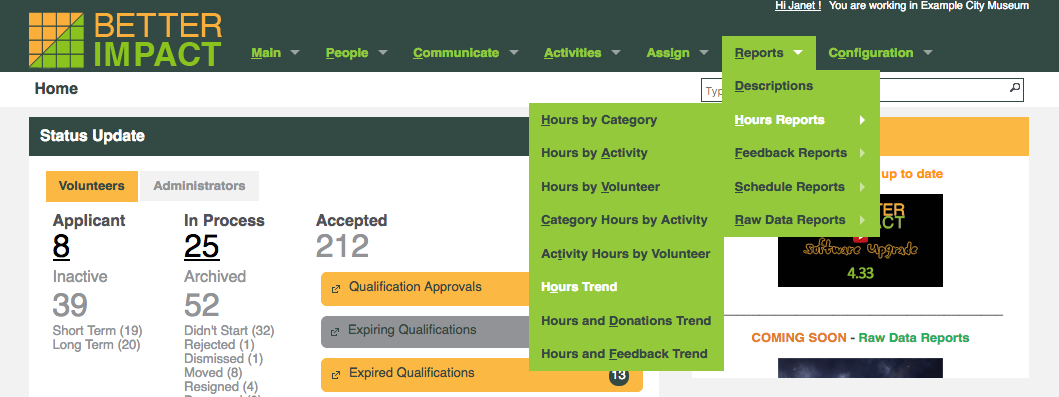
1. Go to: Reports >> Hours Reports >> Hours Trend.
2. Select your desired file format and start date.
3. Click the [View Report] button to see the report on the screen.
4. Click the [Export Report] button to generate a PDF version.